Prometheus
Learn how to integrate Prometheus with Strapi.

Why Use Prometheus
Prometheus is an open-source monitoring and alerting toolkit that has become a standard in the cloud-native ecosystem. It's equiped with autonomous operation, powerful query language, flexible service discovery and comprehensive visualization.
Visit the Prometheus documentation for more.
Why Use Strapi
Strapi is the leading open-source headless CMS offering features, like customizable APIs, role-based permissions, multilingual support, etc. It simplifies content management and integrates effortlessly with modern frontend frameworks.
Explore the Strapi documentation for more details.
Strapi 5 Highlights
The out-of-the-box Strapi features allow you to get up and running in no time:
- Single types: Create one-off pages that have a unique content structure
- Customizable API: With Strapi, you can just hop in your code editor and edit the code to fit your API to your needs.
- Integrations: Strapi supports integrations with Cloudinary, SendGrid, Algolia, and others.
- Editor interface: The editor allows you to pull in dynamic blocks of content.
- Authentication: Secure and authorize access to your API with JWT or providers.
- RBAC: Help maximize operational efficiency, reduce dev team support work, and safeguard against unauthorized access or configuration modifications.
- i18n: Manage content in multiple languages. Easily query the different locales through the API.
Learn more about Strapi 5.
Setup Strapi 5 Headless CMS
We are going to start by setting up our Strapi 5 project with the following command:
🖐️ Note: make sure that you have created a new directory for your project.
You can find the full documentation for Strapi 5 here.
Install Strapi
npx create-strapi-app@latest serverYou will be asked to choose if you would like to use Strapi Cloud we will choose to skip for now.
 Strapi   v5.6.0 🚀 Let's create your new project

To deploy your project, create a new project on the Strapi Cloud dashboard.

? Please log in or sign up.
  Login/Sign up
❯ Skip
After that, you will be asked how you would like to set up your project. We will choose the following options:
? Do you want to use the default database (sqlite) ? Yes
? Start with an example structure & data? Yes <-- make sure you say yes
? Start with Typescript? Yes
? Install dependencies with npm? Yes
? Initialize a git repository? Yes
Once everything is set up and all the dependencies are installed, you can start your Strapi server with the following command:
cd server
npm run develop
You will be greeted with the Admin Create Account screen.
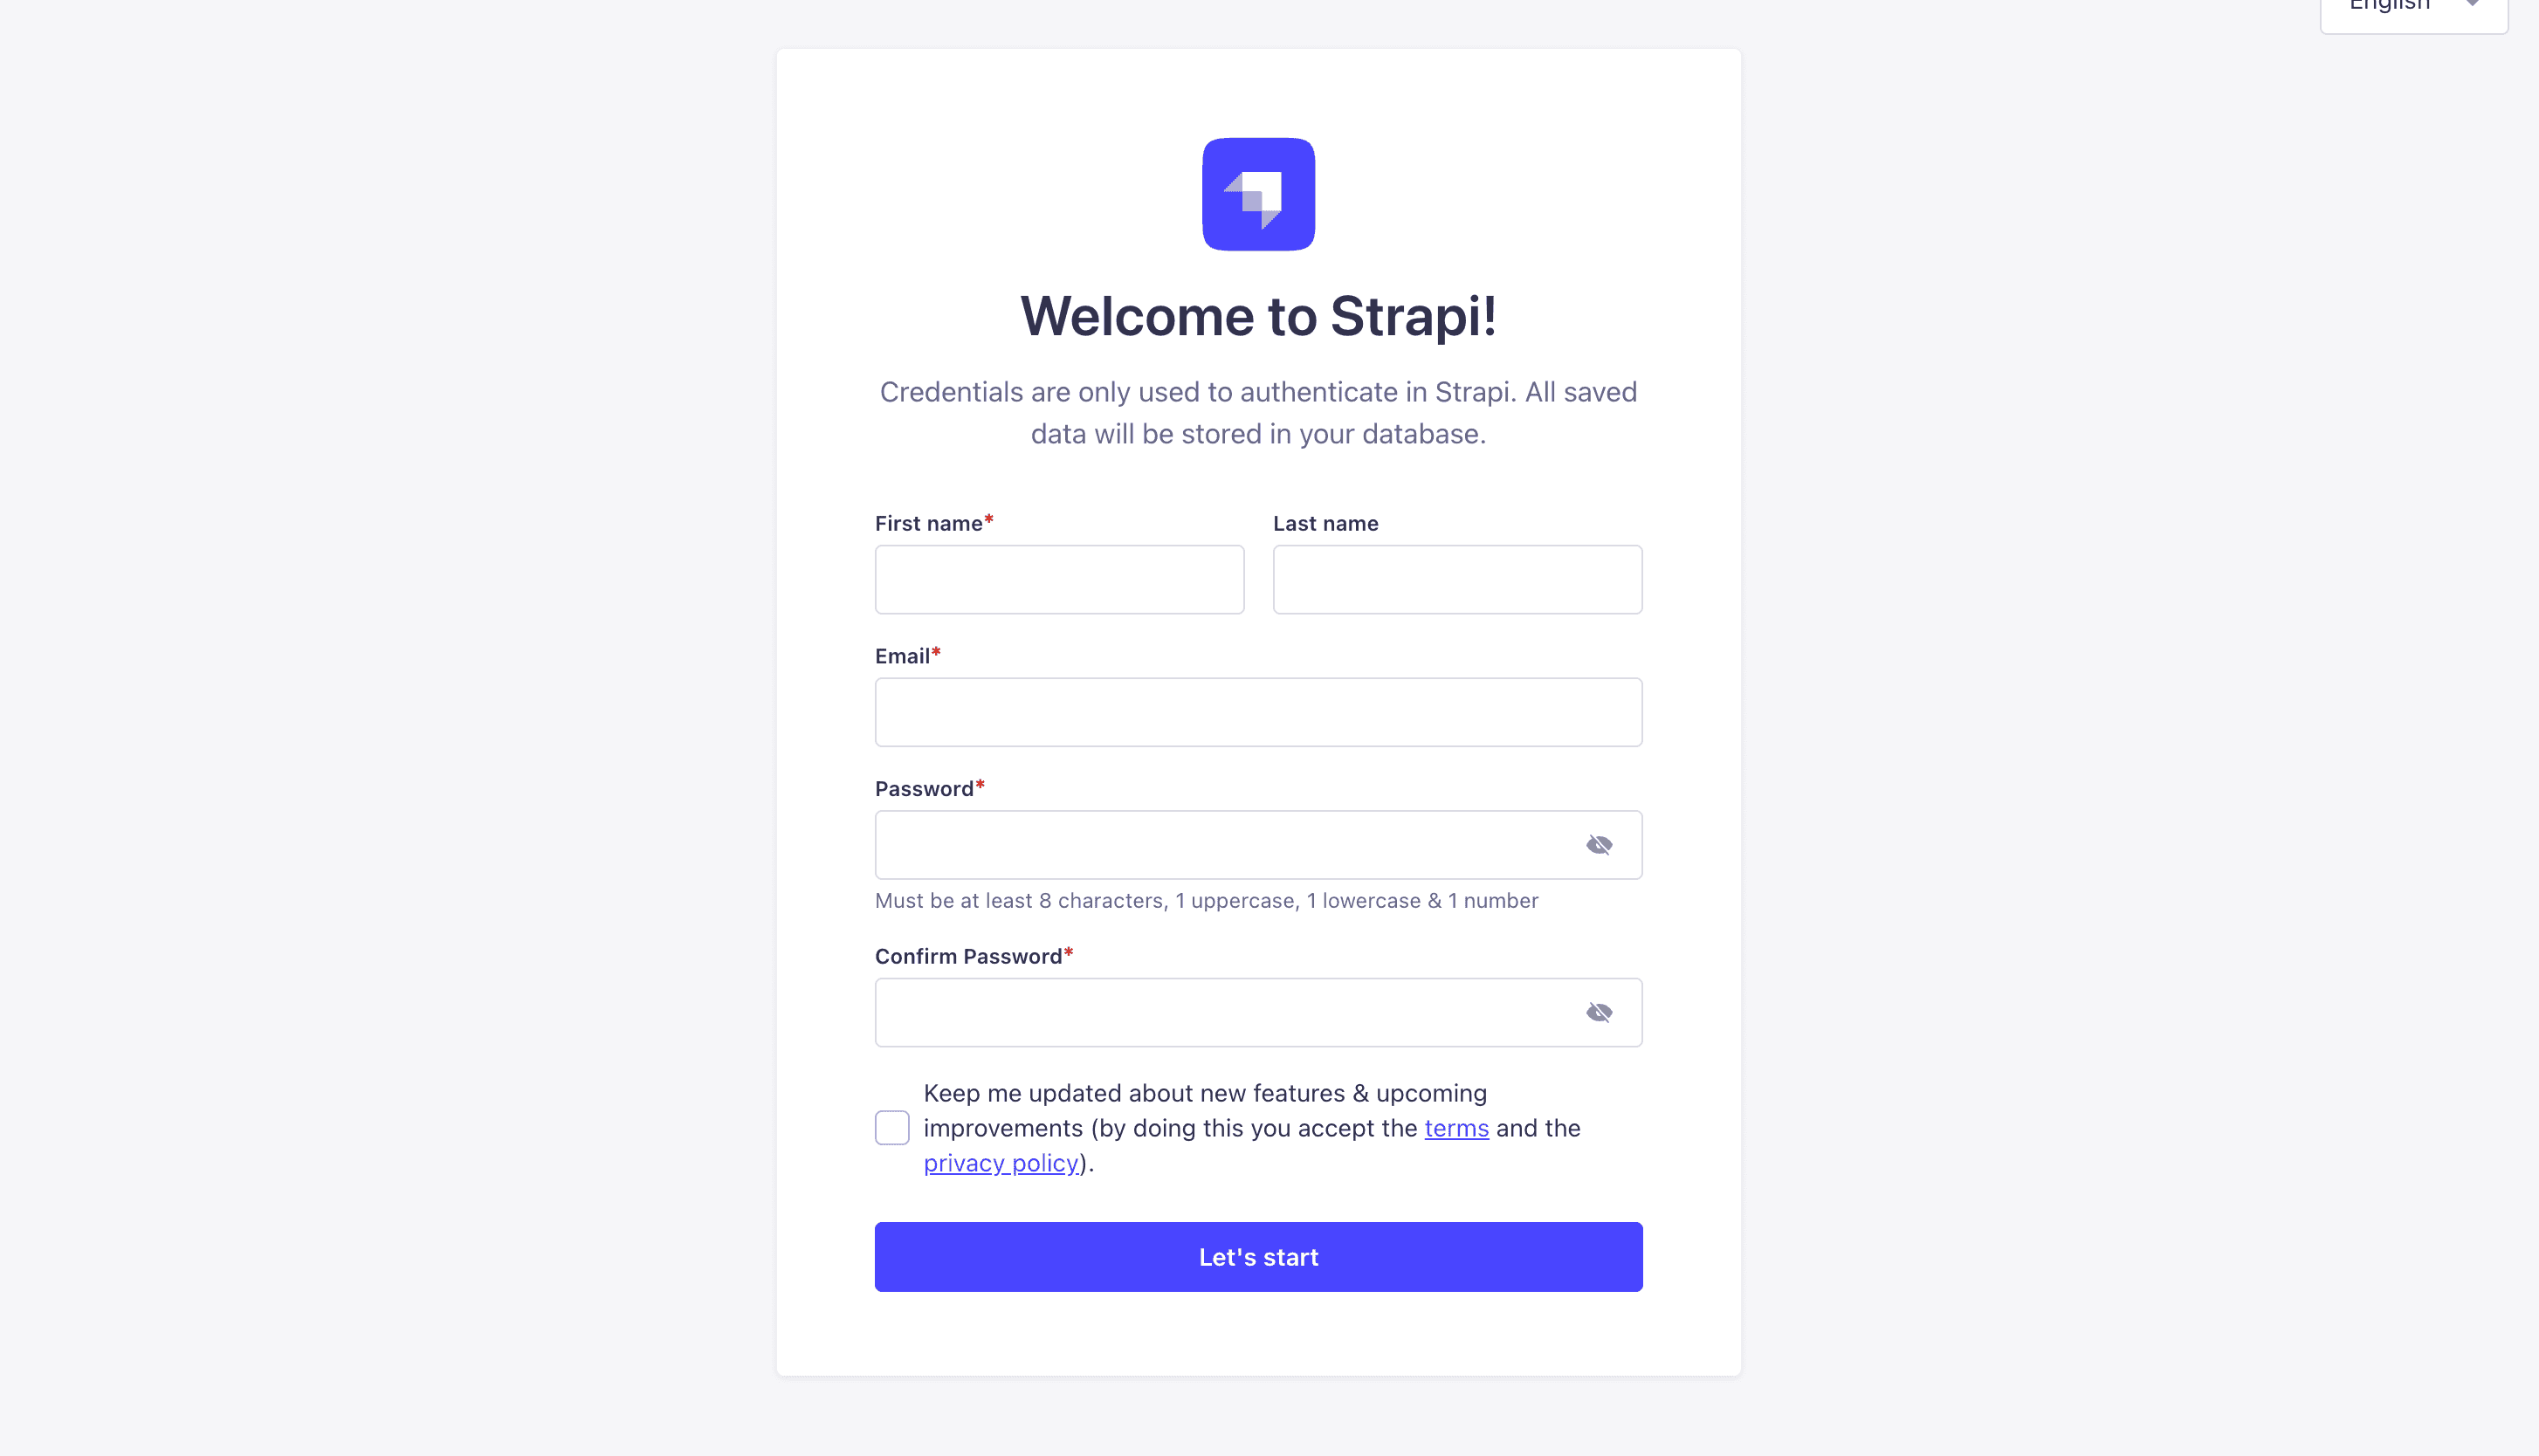
Go ahead and create your first Strapi user. All of this is local so you can use whatever you want.
Once you have created your user, you will be redirected to the Strapi Dashboard screen.
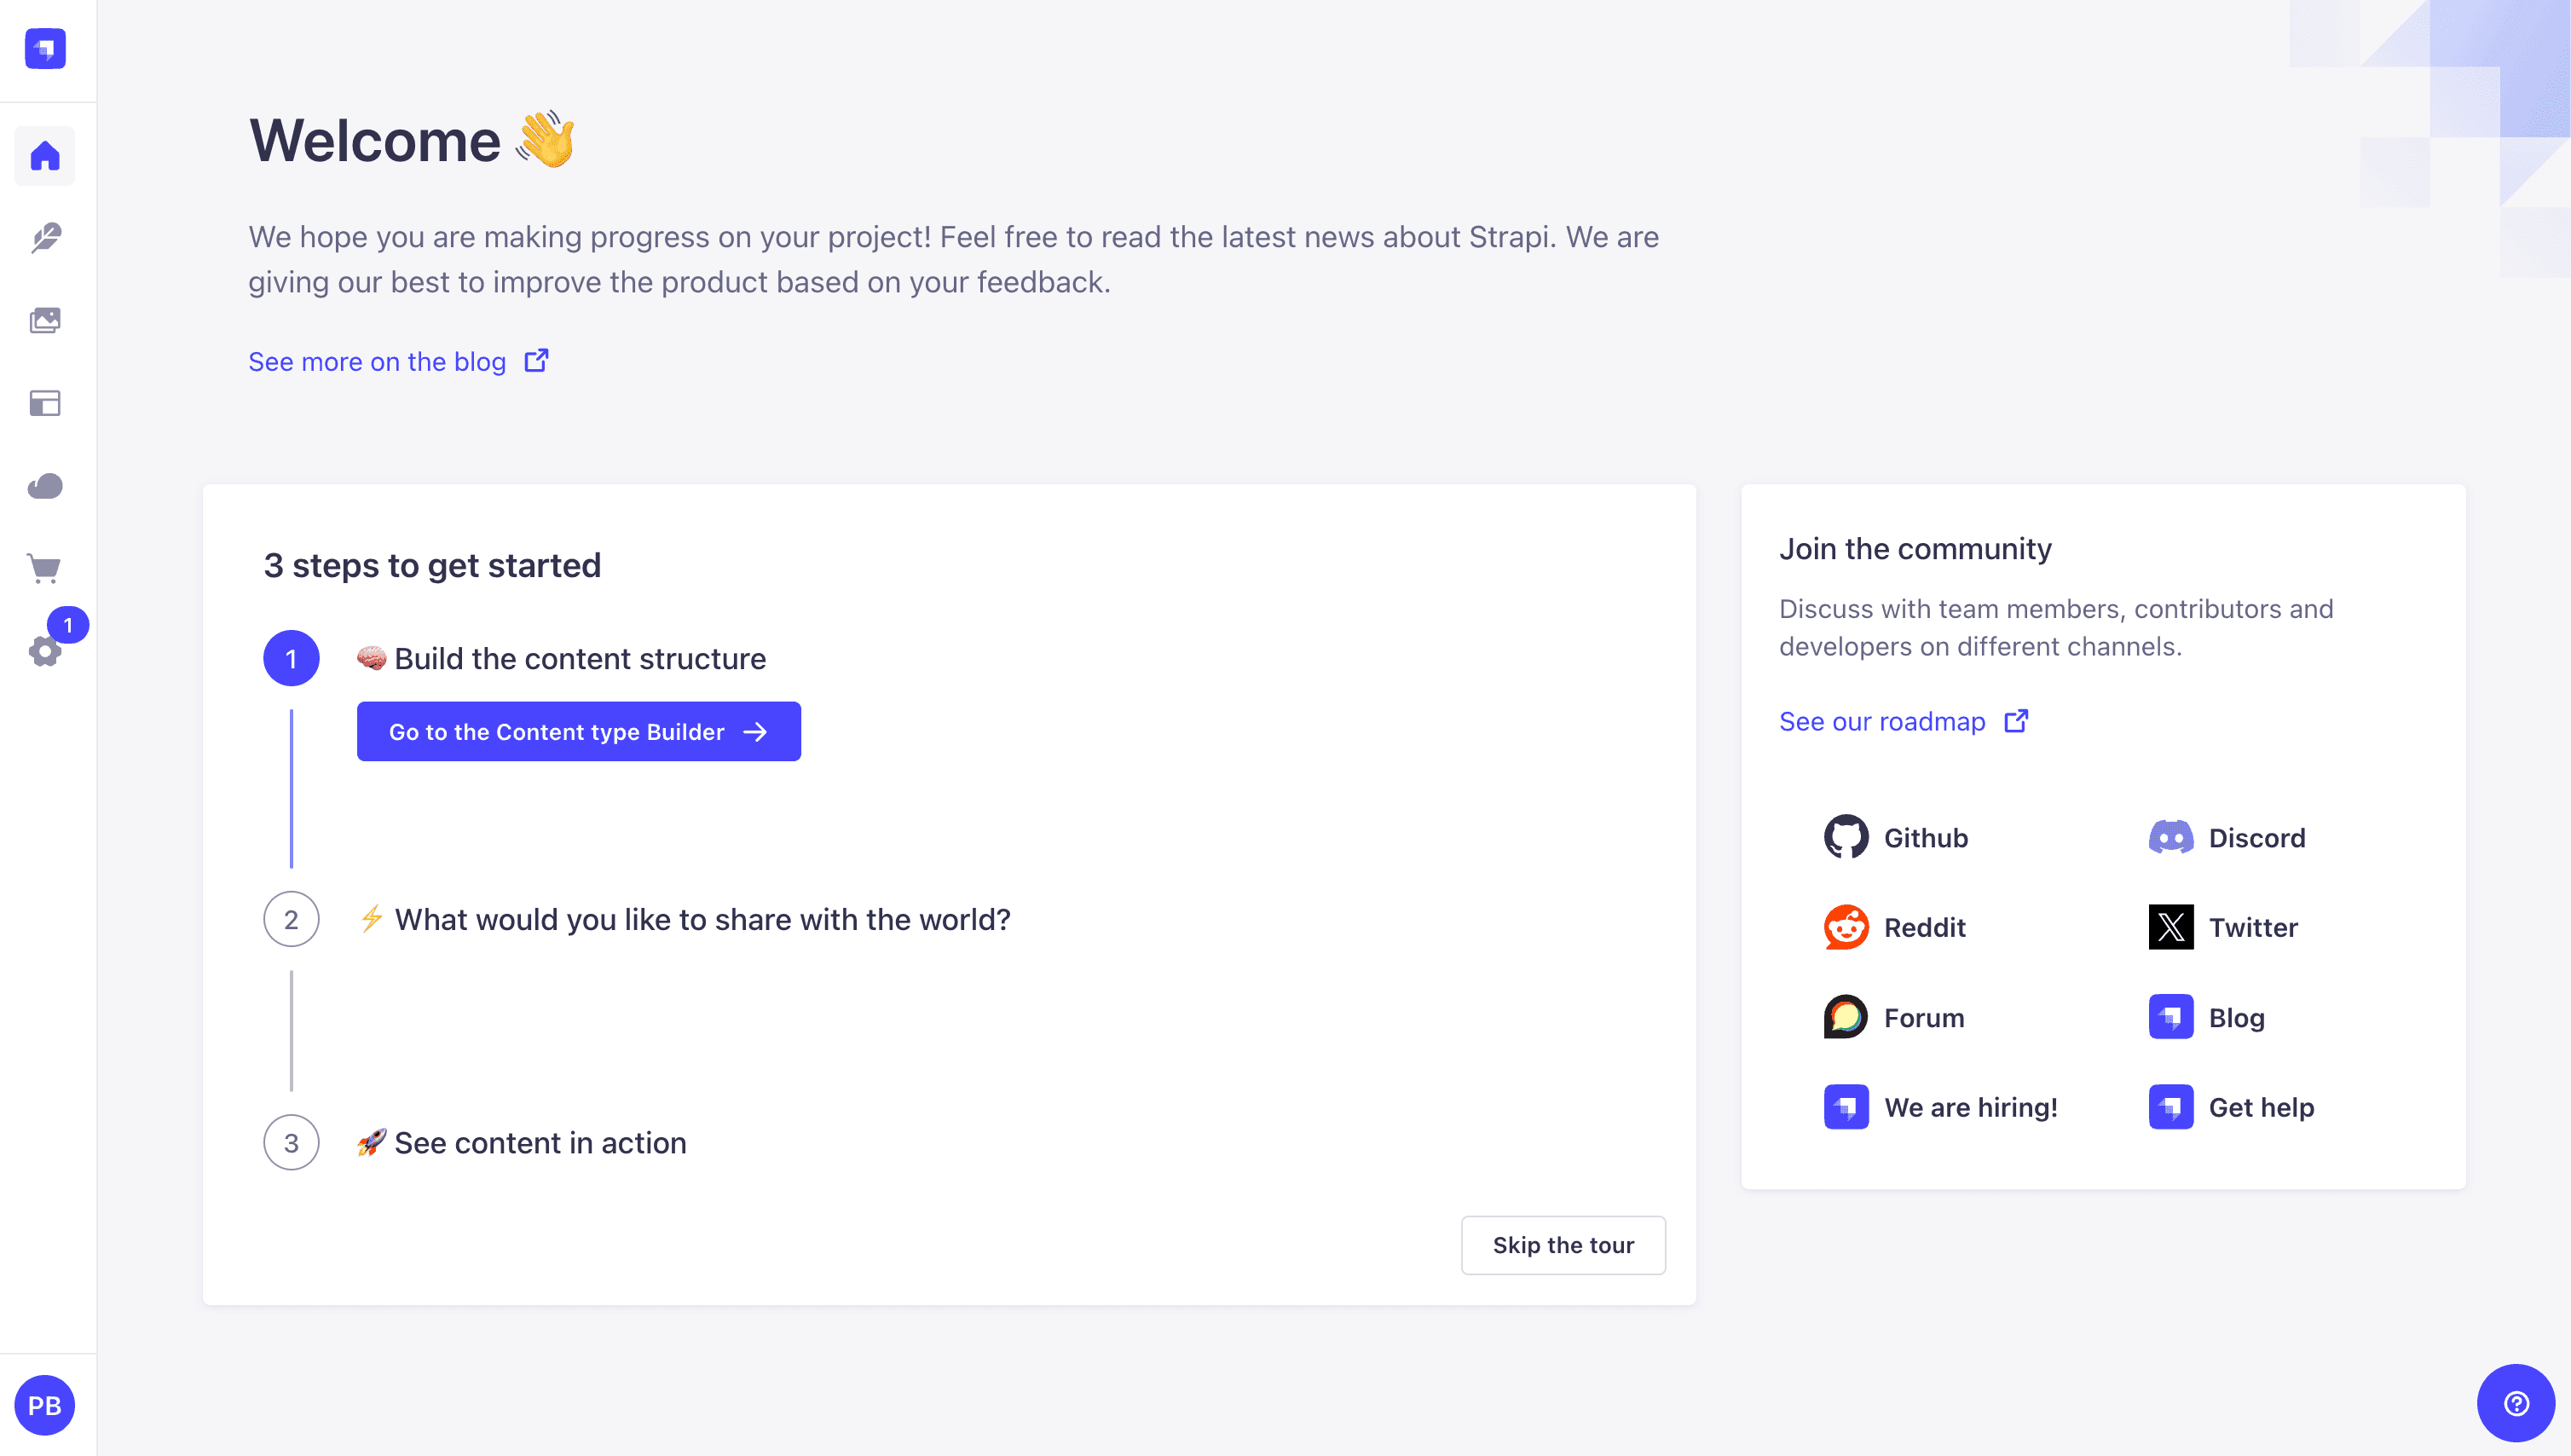
Publish Article Entries
Since we created our app with the example data, you should be able to navigate to your Article collection and see the data that was created for us.
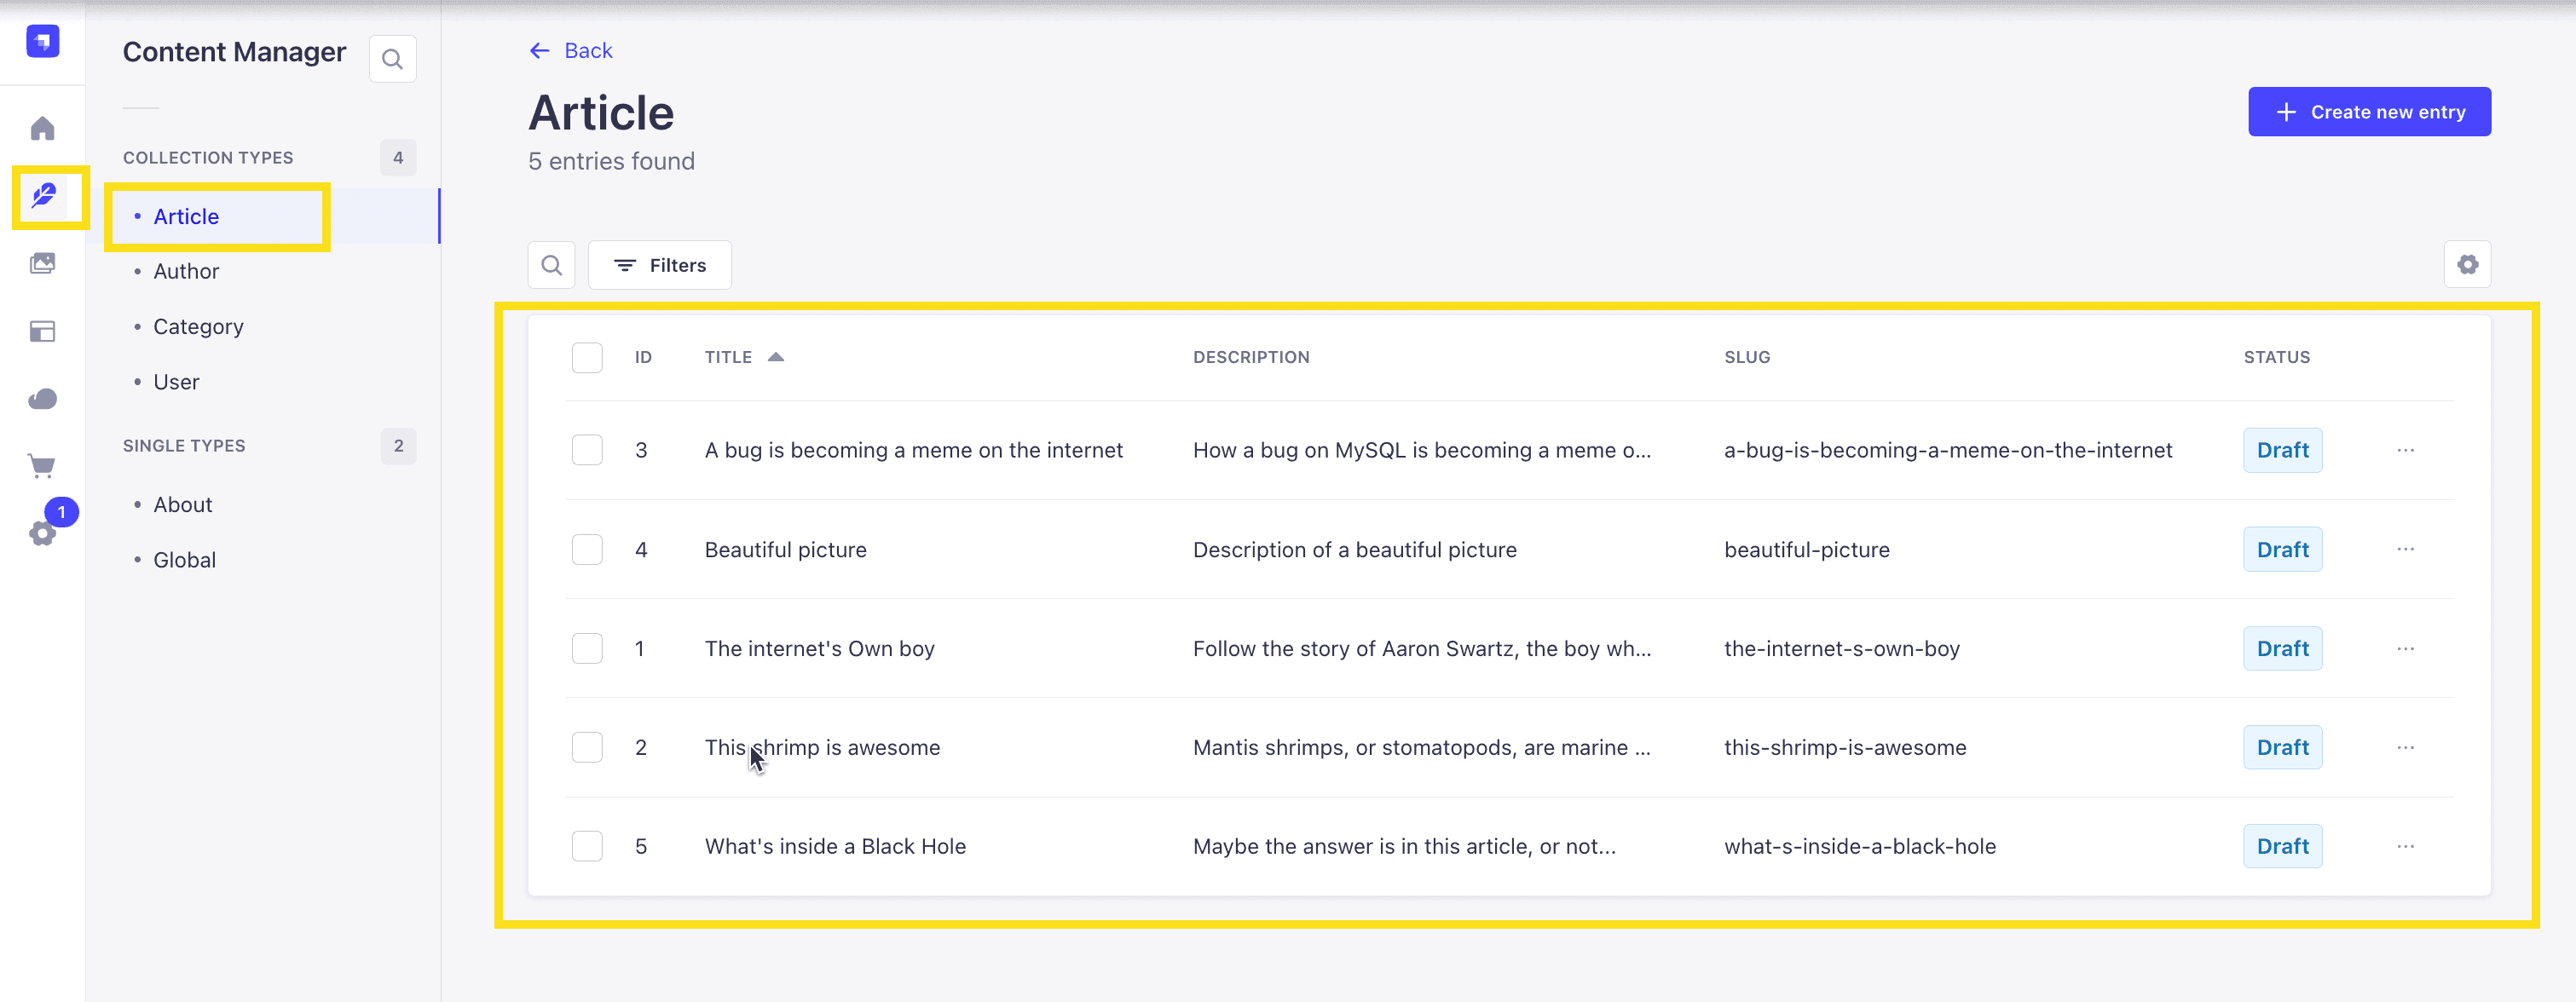
Now, let's make sure that all of the data is published. If not, you can select all items via the checkbox and then click the Publish button.
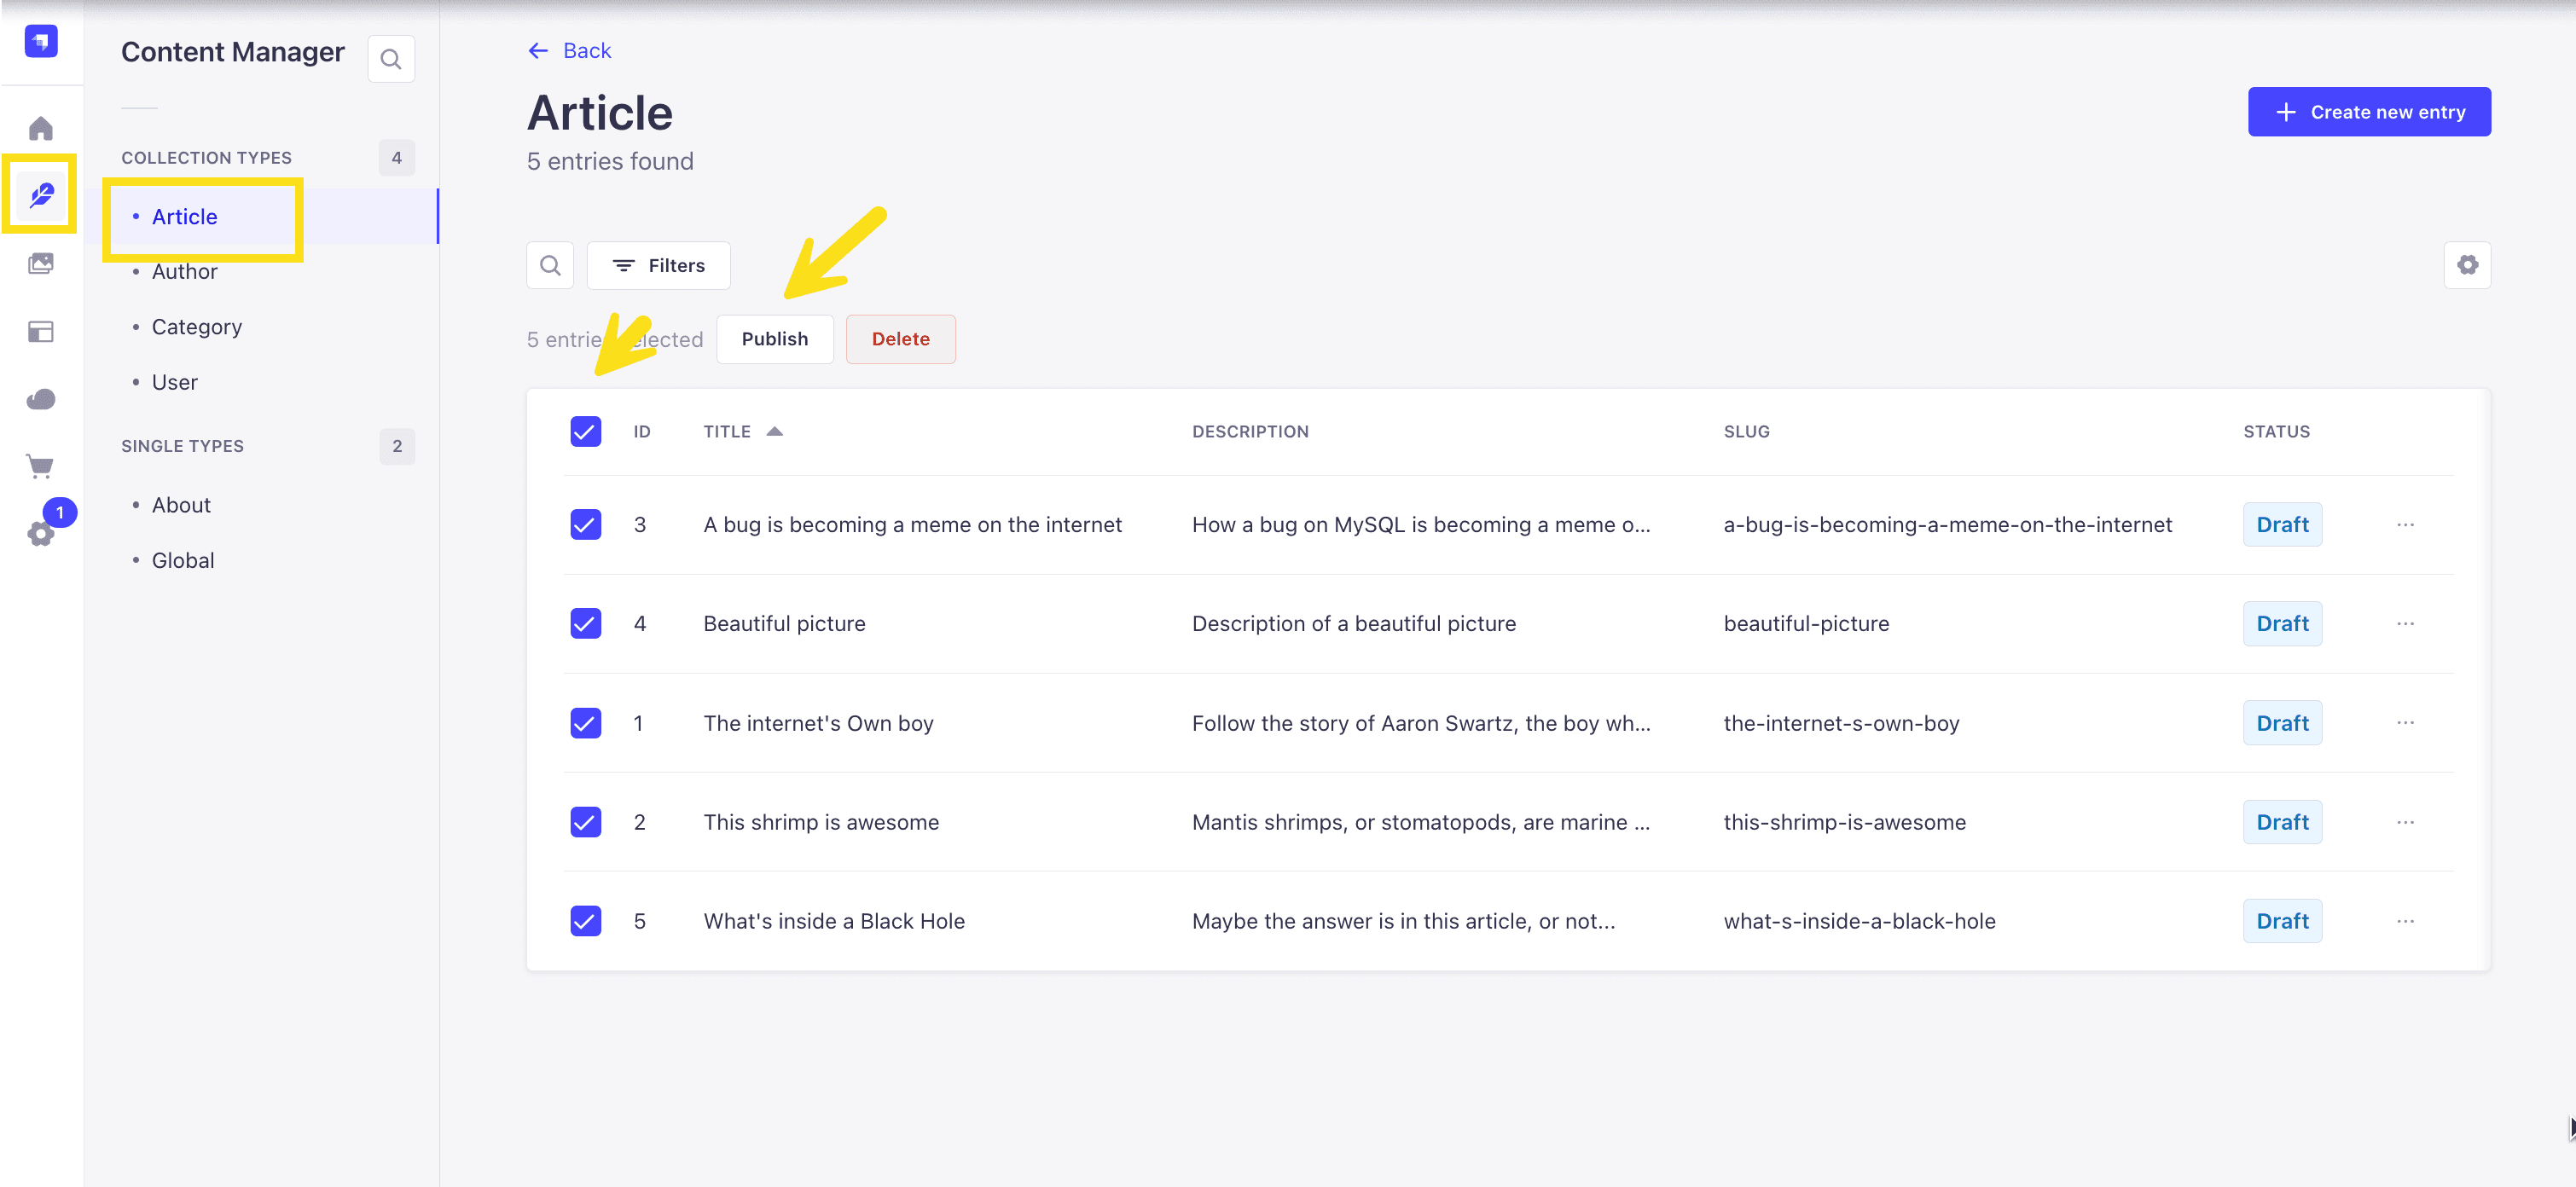
Enable API Access
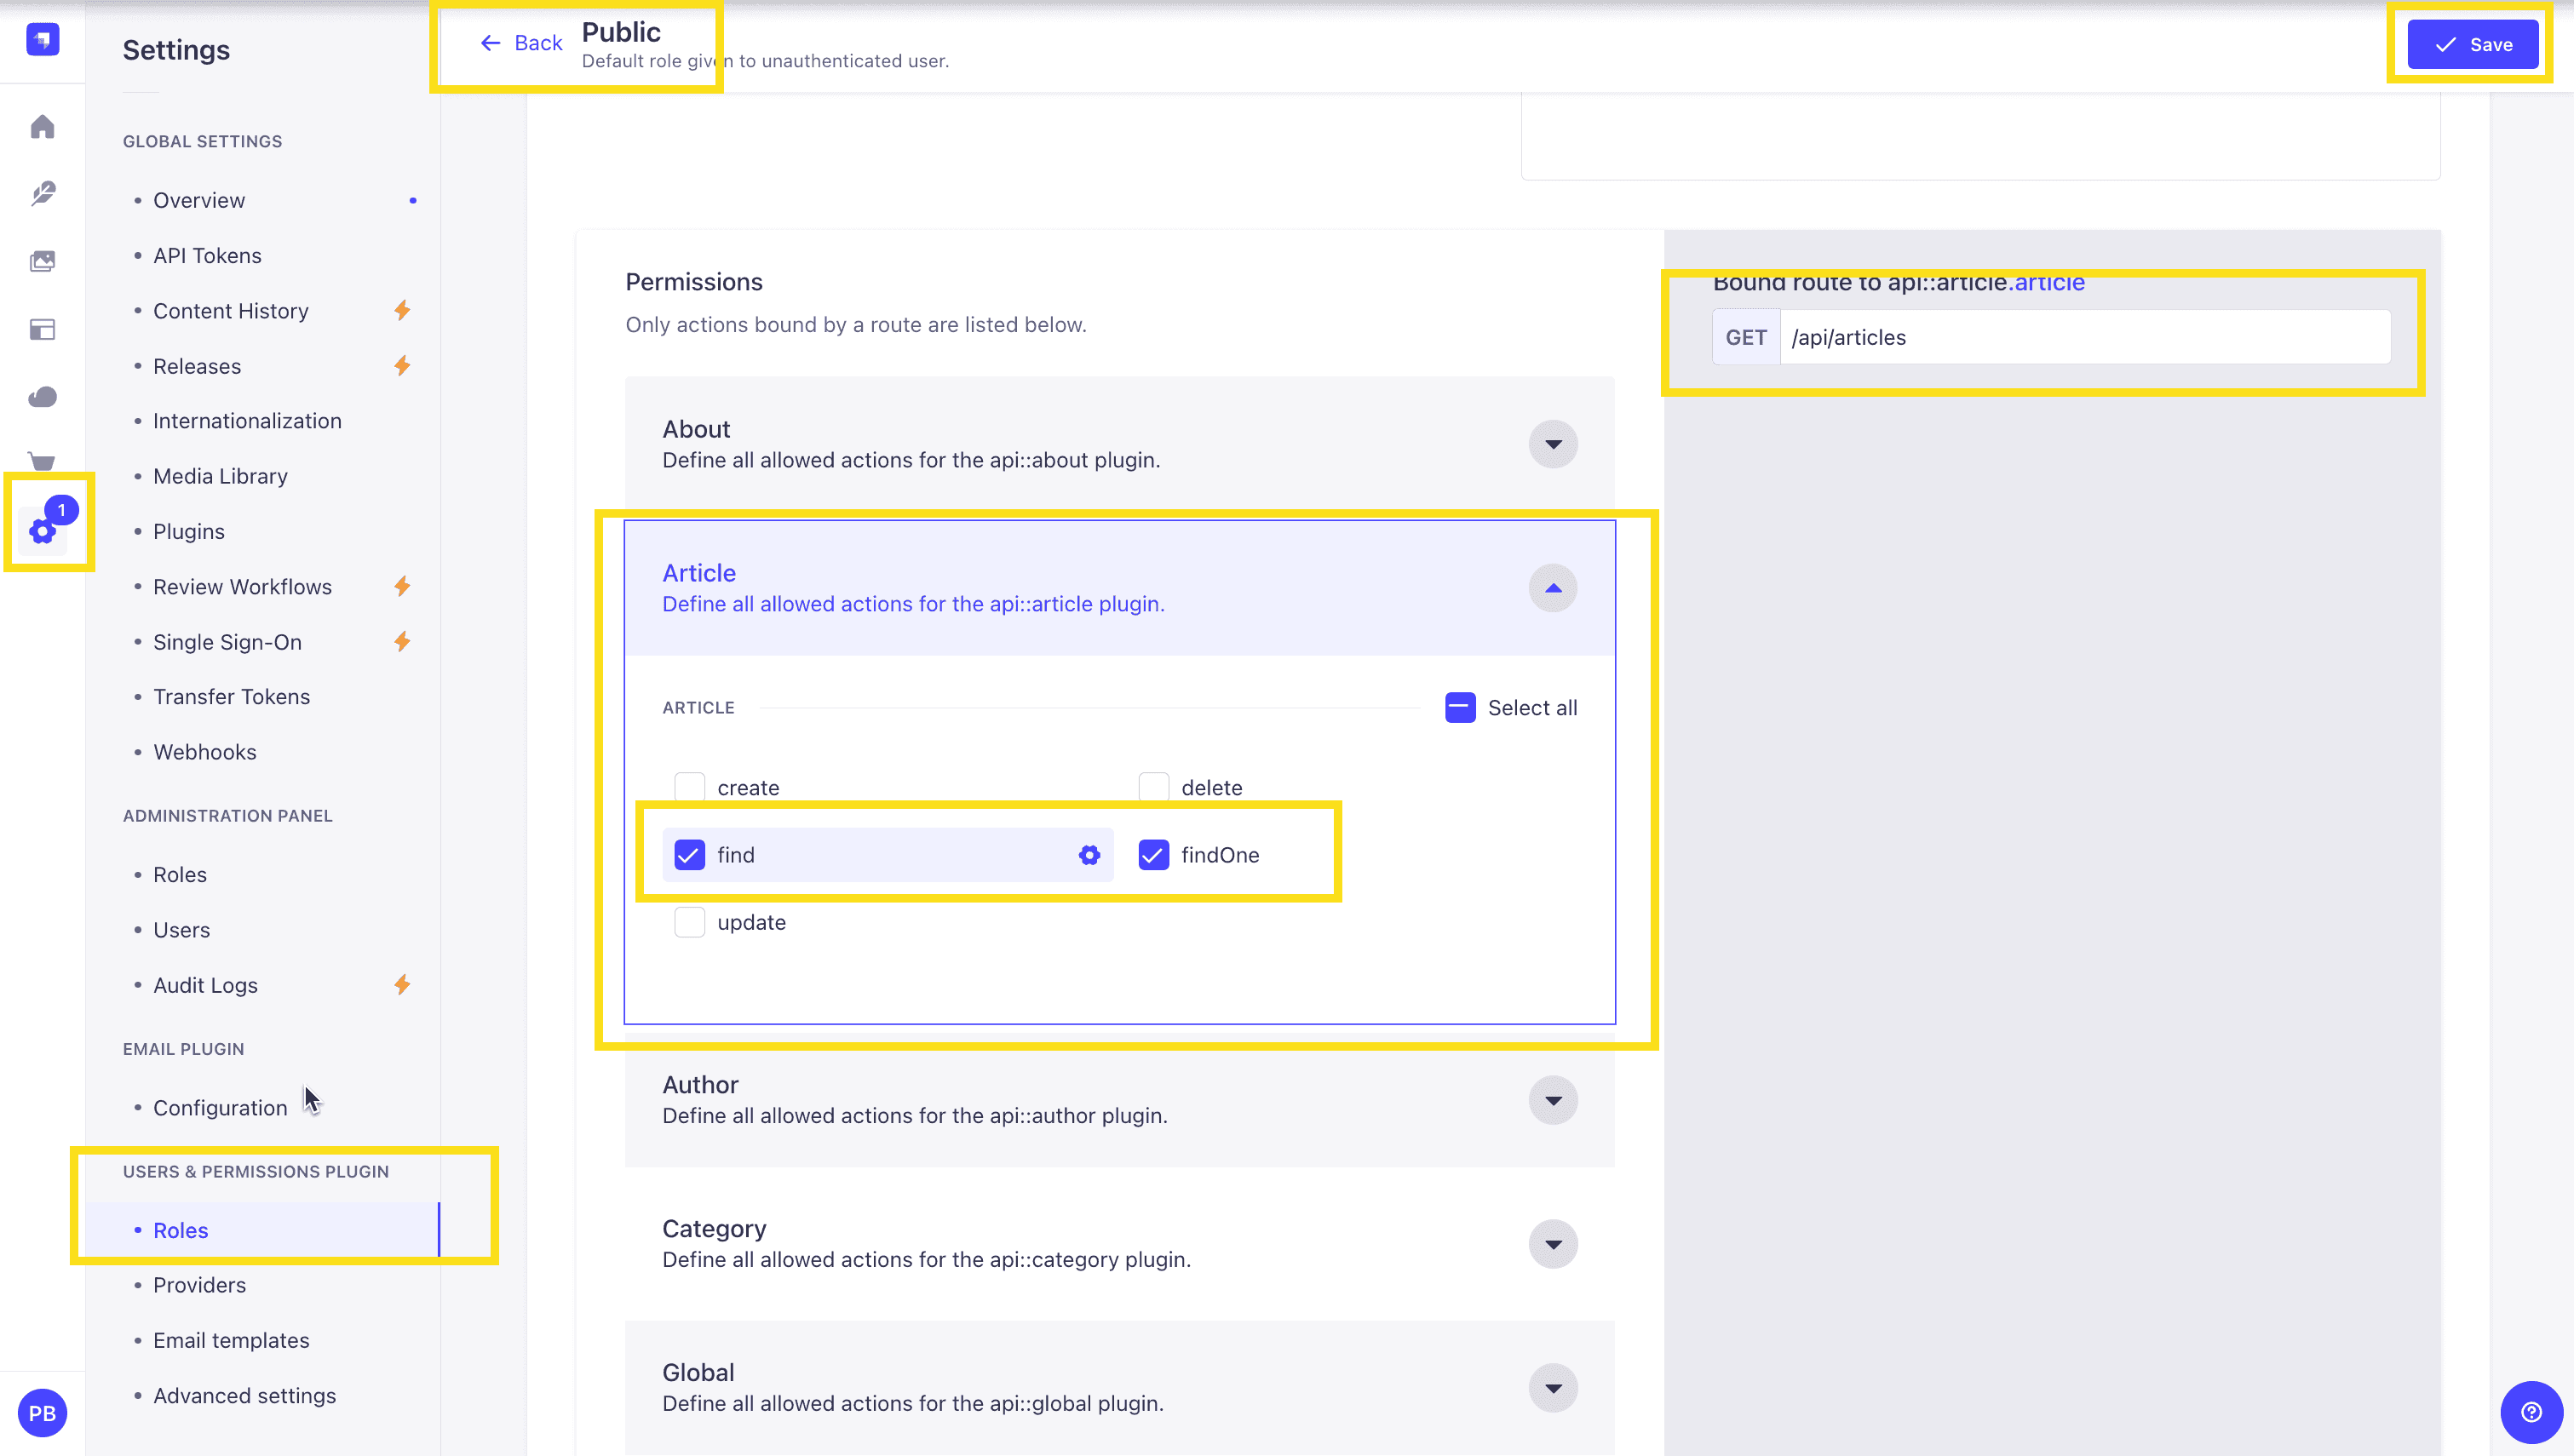
Once all your articles are published, we will expose our Strapi API for the Articles Collection. This can be done in Settings -> Users & Permissions plugin -> Roles -> Public -> Article.
You should have find and findOne selected. If not, go ahead and select them.
Test API
Now, if we make a GET request to http://localhost:1337/api/articles, we should see the following data for our articles.
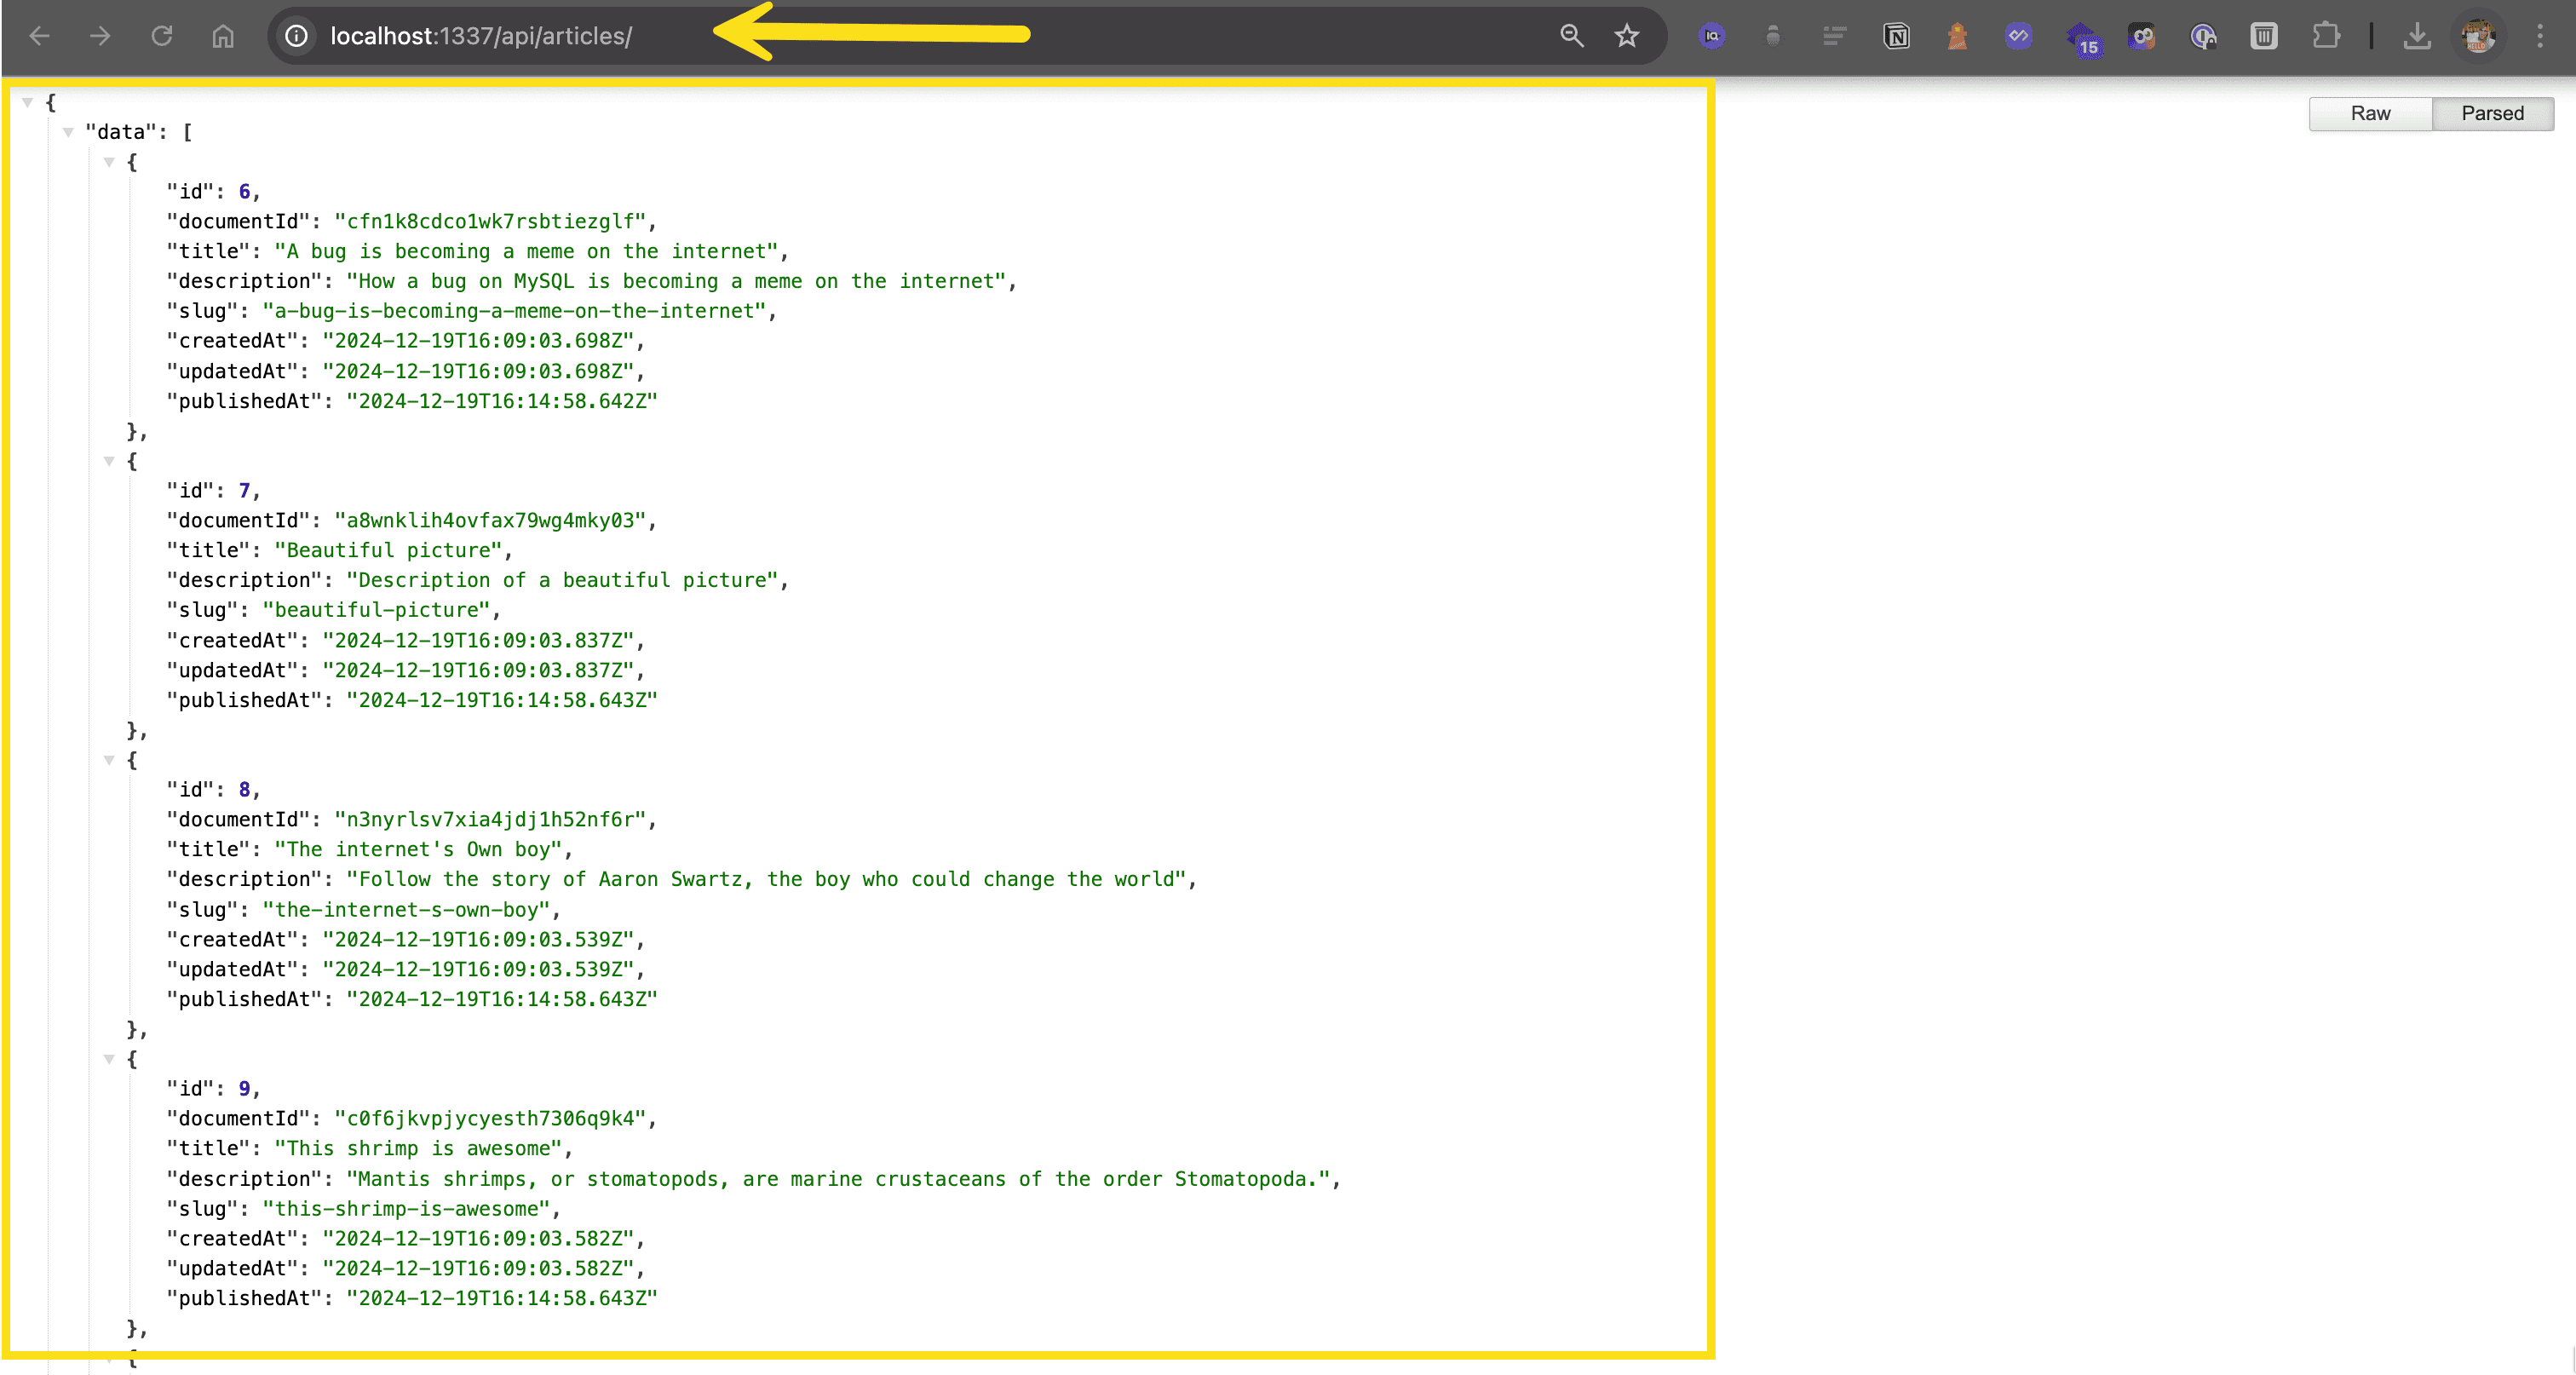
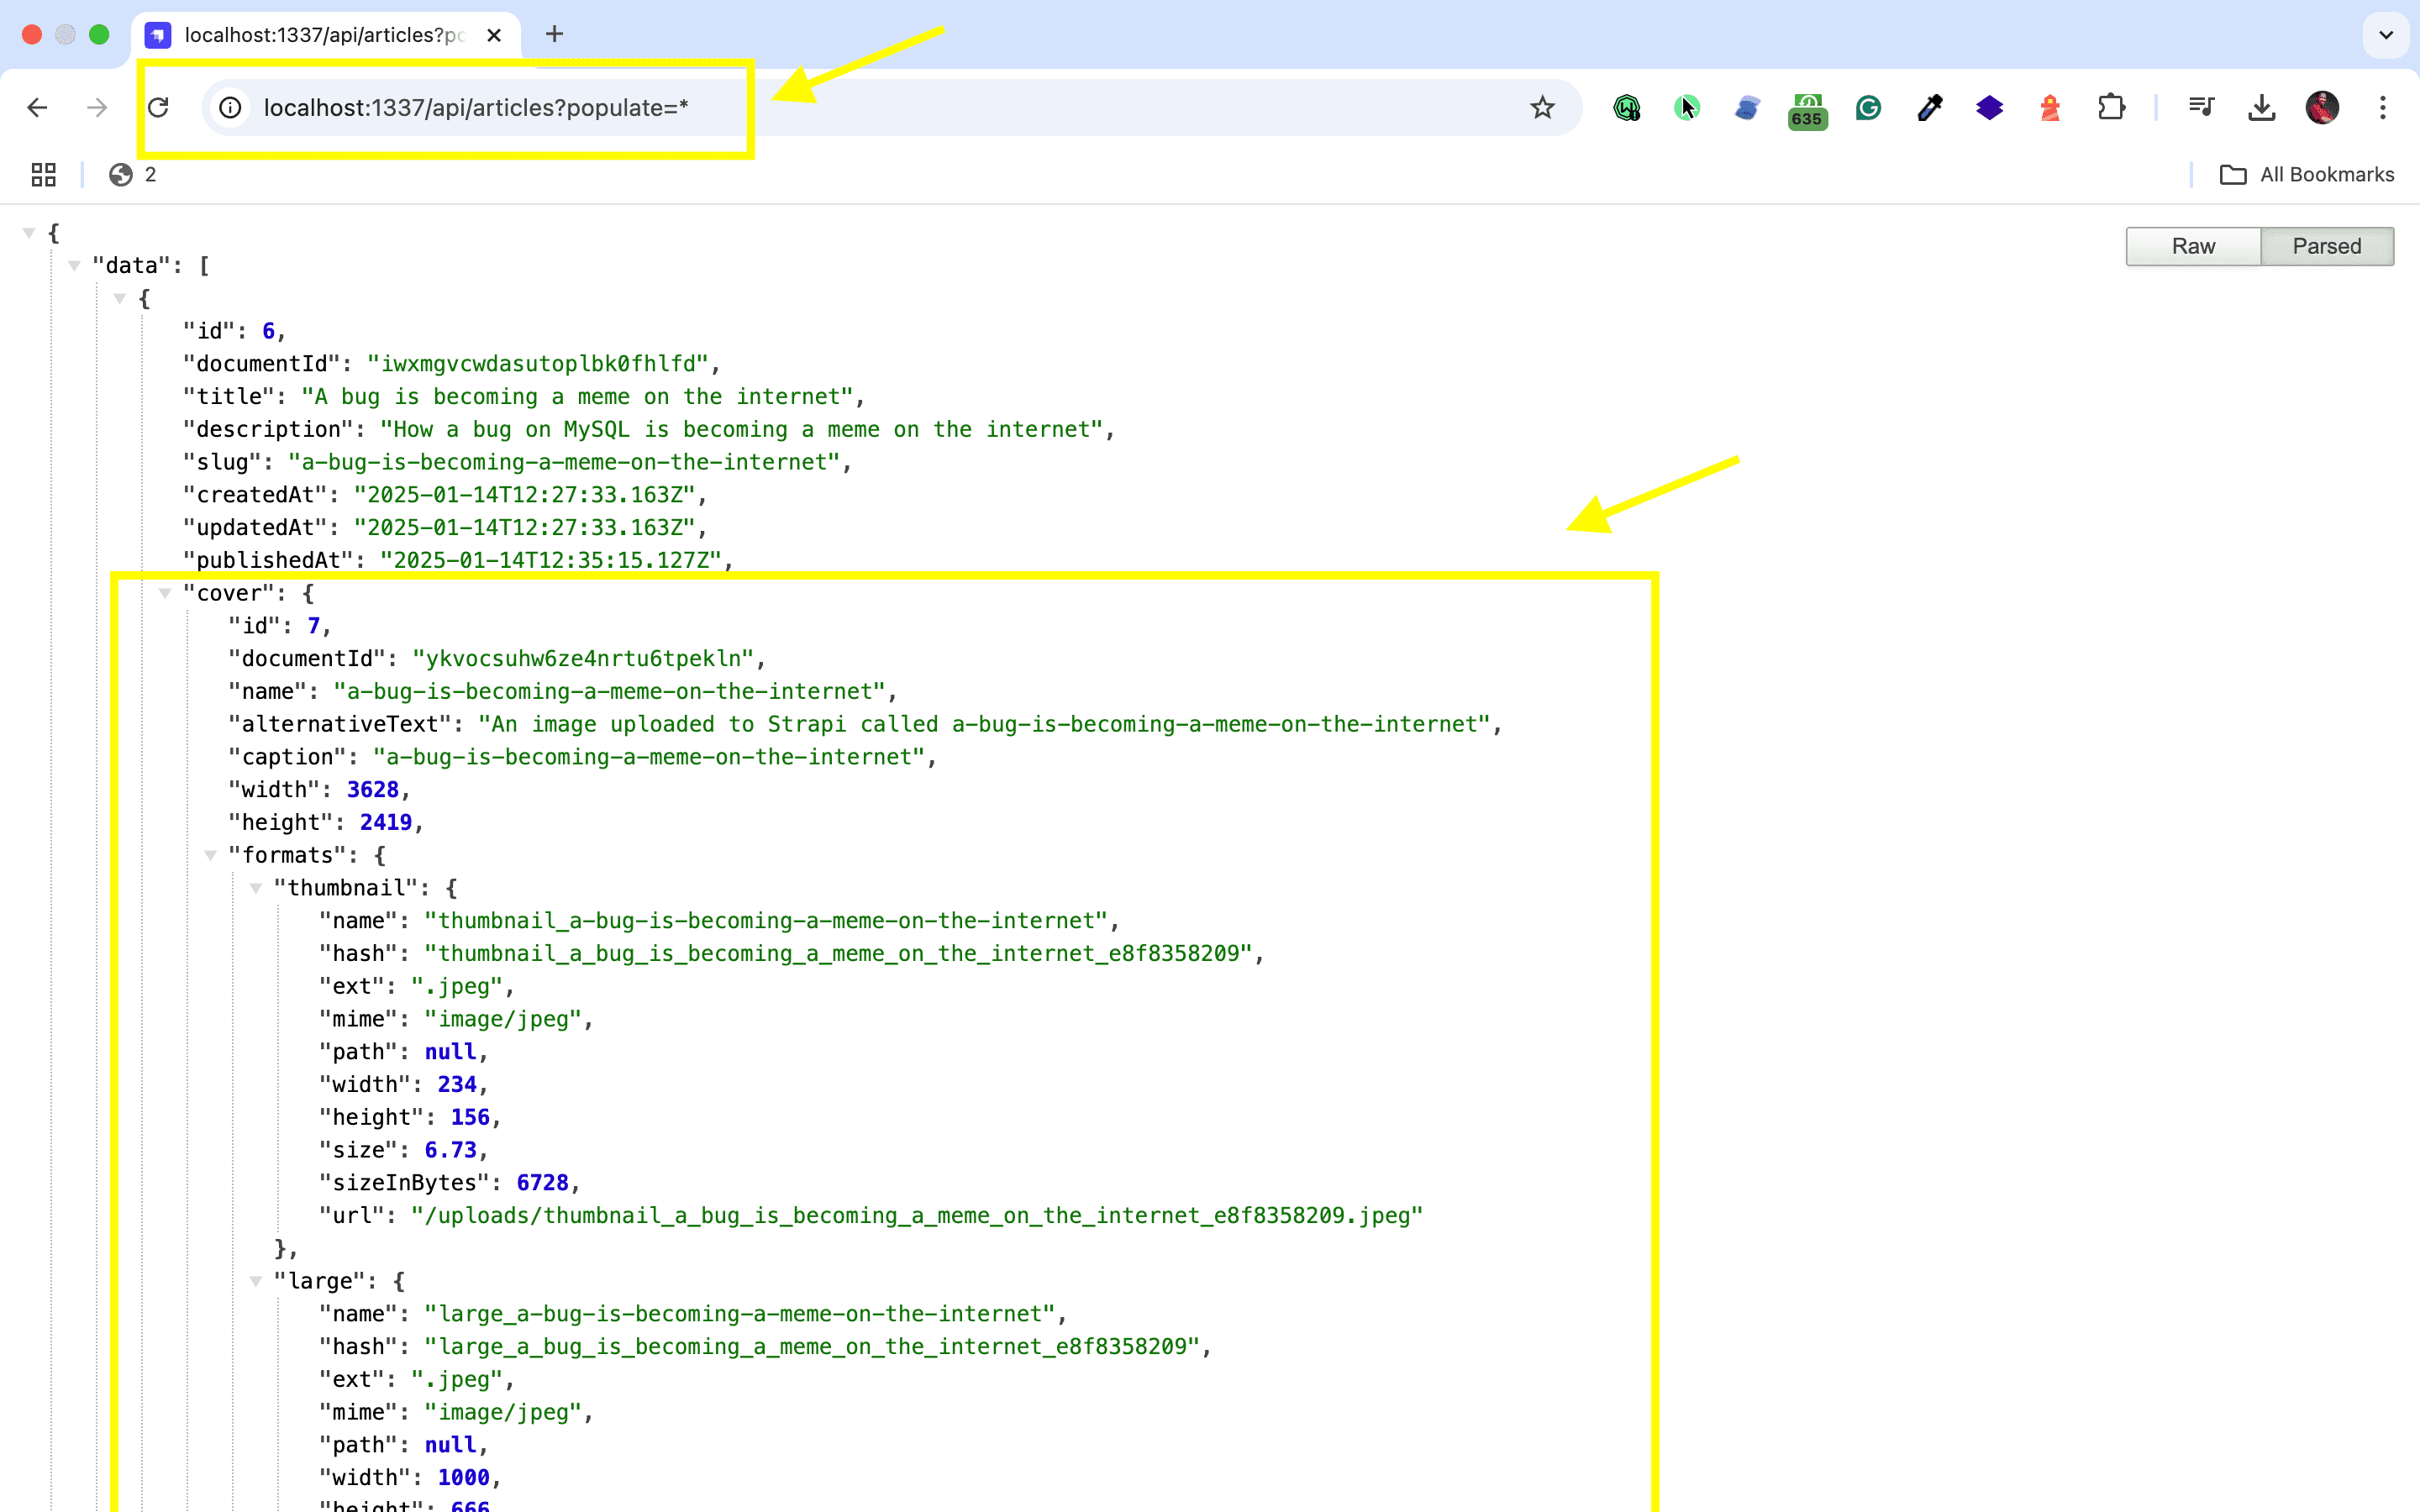
🖐️ Note: The article covers (images) are not returned. This is because the REST API by default does not populate any relations, media fields, components, or dynamic zones.. Learn more about REST API: Population & Field Selection.
So, let's get the article covers by using the populate=* parameter: http://localhost:1337/api/articles?populate=*
Getting Started with Prometheus
When integrating Prometheus with Strapi for monitoring and observability, you'll need to follow a structured approach to ensure reliable implementation and testing. Let's walk through the essential steps and best practices.
Initial Setup
To set up Prometheus monitoring in your Strapi application, refer to the official documentation or the plugin's repository for the most accurate installation and configuration instructions.
Testing Strategies
Implementing comprehensive testing is important for ensuring reliable monitoring. Here are the key testing approaches you should implement:
- Unit Testing
- Create isolated tests for individual monitoring components
- Validate metric collection functions
- Test alert rule conditions
- Integration Testing
- Verify Prometheus and Strapi communication
- Test metric endpoint accessibility
- Validate data flow between components
- Load Testing
- Simulate high traffic scenarios
- Monitor system behavior under stress
- Verify metric collection accuracy during peak loads
Error Handling and Debugging
Implement robust error handling mechanisms to maintain system reliability:
- Logging Setup
- Implement structured logging for all monitoring events
- Include timestamps, error messages, and context
- Store logs in a searchable format
- Common Issues and Solutions
- Connection timeouts: Check network connectivity and firewall rules
- Authentication failures: Verify credentials and permissions
- Data inconsistencies: Validate metric collection intervals
- Debugging Tools
- Use the Prometheus expression browser at port 9090
- Implement monitoring dashboards for visual debugging
- Use logging tools for tracing issues
Best Practices for Production
Follow these best practices to ensure optimal monitoring in production:
- Metric Collection
- Use meaningful metric names and labels
- Implement appropriate collection intervals
- Monitor only necessary metrics to avoid overhead
- Alert Configuration
- Set up meaningful alert thresholds
- Implement alert grouping and routing
- Configure proper notification channels
- Performance Optimization
- Regular metric cleanup and aggregation
- Implement proper retention policies
- Monitor Prometheus resource usage
Monitoring Setup
Configure your Prometheus YAML file to scrape metrics from your Strapi application:
scrape_configs:

  - job_name: 'strapi'

    static_configs:

      - targets: \['your-strapi-url:port'\]
Proper monitoring is critical for business continuity to minimize the financial impact of system downtime.
For visualization, consider monitoring with Prometheus and Grafana by connecting your Prometheus instance to Grafana, or use the built-in Prometheus expression browser. This allows you to create custom dashboards and monitor your Strapi application's performance metrics in real-time.
For more detailed information and resources, refer to the official Prometheus documentation and the Strapi v5 documentation.
Awesome, great job!
Strapi Open Office Hours
If you have any questions about Strapi 5 or just would like to stop by and say hi, you can join us at Strapi's Discord Open Office Hours Monday through Friday at 12:30 pm - 1:30 pm CST: Strapi Discord Open Office Hours
For more details, visit the Strapi documentation and [Prometheus] documentation](https://prometheus.io/docs/introduction/overview).
Frequently Asked Questions
Expose metrics from your Strapi application using a Prometheus client library. Configure Prometheus to scrape these metrics for monitoring API performance, database queries, and application health.
Monitor request latency, error rates, database query times, memory usage, and custom business metrics. These help identify performance issues and capacity requirements.
Connect Prometheus to Grafana for dashboard visualization. Create dashboards showing Strapi's key metrics with alerts for anomalies.
Add your Strapi application as a target in Prometheus's configuration file, specifying the metrics endpoint path and scrape interval. Typically scrape every 15-30 seconds.
Yes, Prometheus is production-ready and widely used. Implement proper metric collection, set up alerting rules, and ensure your Prometheus infrastructure scales with your Strapi deployment.