Chartkit
Charts for Strapi v5, rendered as SVG on the server. Add a Chart field to any content type and authors get a live preview above a spreadsheet-style data grid.
Latest version
released October 28, 2026
npm install @qkix/strapi-plugin-chartkit

Chartkit for Strapi
Charts for Strapi v5, rendered as server-side SVG. Your pages ship zero client-side JavaScript to draw them.




npm install @qkix/strapi-plugin-chartkitAdd a Chart field to a content type. That's it - no config file, no provider.
Why server-side SVG
Most chart plugins hand the browser a charting library and some JSON, and let it draw. That means shipping and executing a charting runtime on every page that has a chart, and leaving a hole in the layout until it runs.
Chartkit renders the SVG when the page is built or requested. The browser receives finished markup:
- No runtime. Nothing to download, parse, or execute.
- Nothing to hydrate, so no layout shift and no flash of empty box.
- It scales and prints - it is vector, not a canvas bitmap.
- Screen readers get a real description:
role="img"with a<title>and the description you wrote.
Every chart type
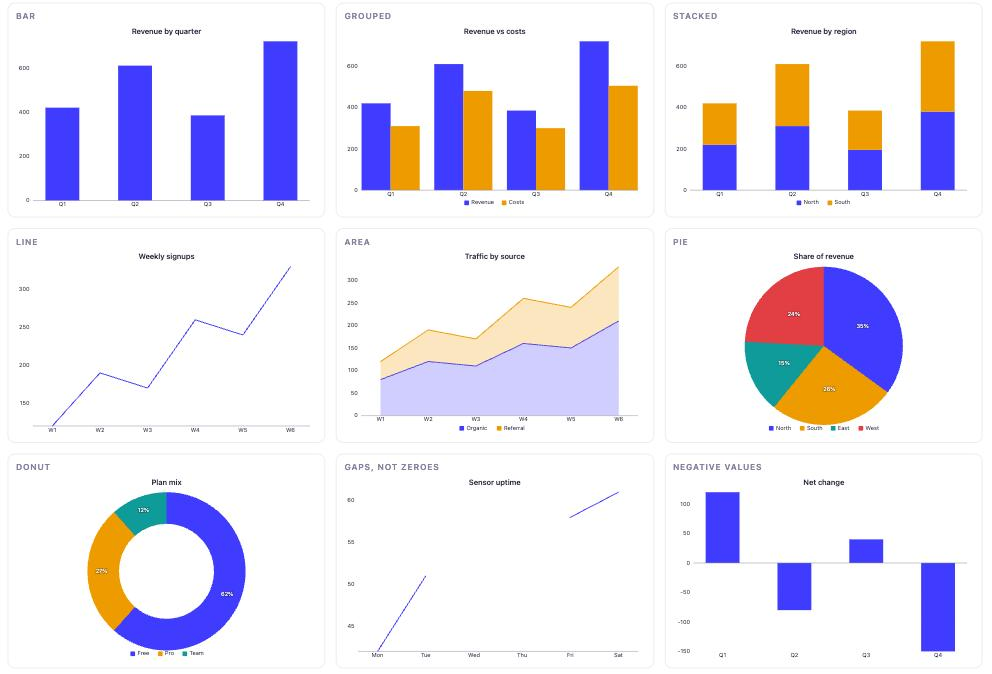
Bar, grouped and stacked bars, line, area and stacked area, pie and donut.
Two of those tiles are the details that usually go wrong. A missing reading stays a gap - never a zero pretending to be a measurement. And negative values get a real baseline instead of being flipped or clipped.
Editing
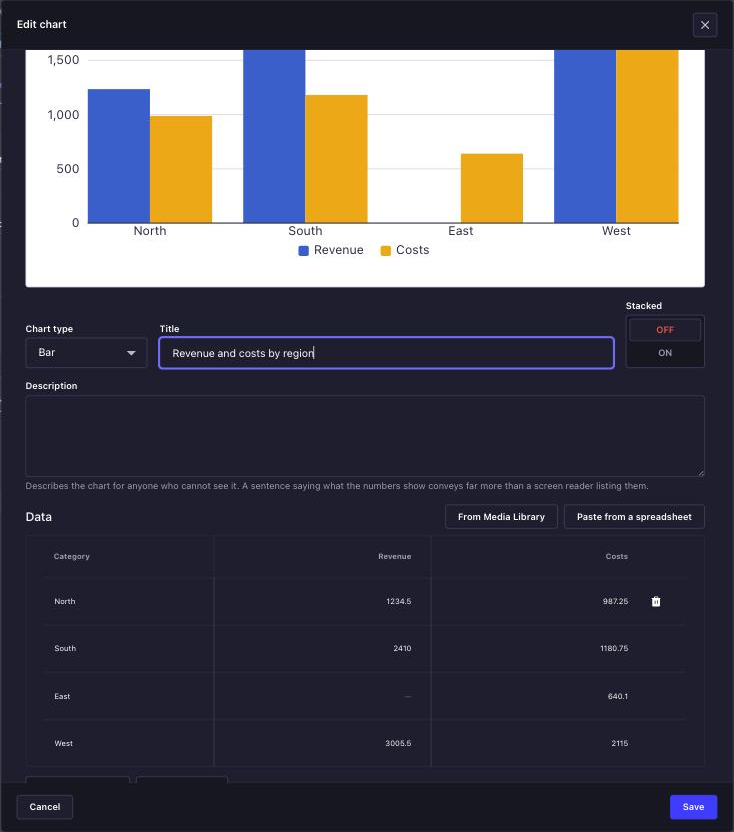
A live preview above a spreadsheet-style grid. The preview is the real renderer - the same function that draws the published page - so a chart cannot look right here and wrong there.
The editor opens in a dialog. Cancel genuinely cancels: it edits a draft and only writes on save.
Labels are dates
Turn this on and the labels stop being names and become instants: readings are placed by when they are, so a day's gap and a fortnight's gap no longer look alike. Ticks then come from the calendar rather than from your rows, which is what lets a year of daily figures label itself with a few months instead of 365 smeared dates.
Labels have to be dates for it - ISO 8601, e.g. 2026-08-20. One that is not is
named in the editor rather than quietly drawn as a category again.
Off by default, including for labels that look like dates: 2024 and 2025 may
be two categories you meant to weigh equally, and re-spacing them because they
parse would be a decision this plugin has no business making for you.
Three ways to get the numbers in
Most charts already exist as numbers somewhere, and retyping them is the worst part of every charting tool.
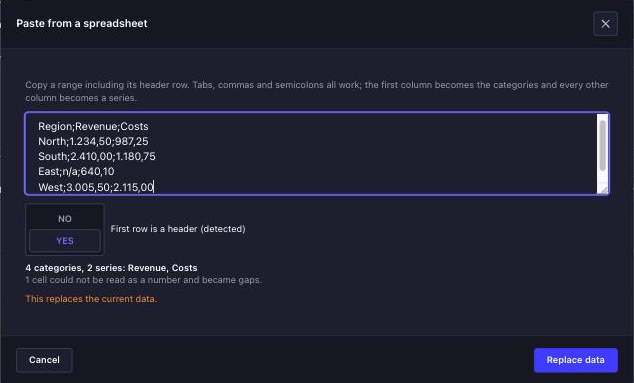
Paste from a spreadsheet. Copy a range out of Sheets or Excel and paste it.
| Input | Read as |
|---|---|
| tab, comma or semicolon | detected per paste |
1.234,50 and 1,234.50 | 1234.5 either way |
€1 234,50 | 1234.5 - currency and spaces stripped |
"North, inland" | one cell; a quoted delimiter survives |
n/a, -, empty | a gap, never a zero |
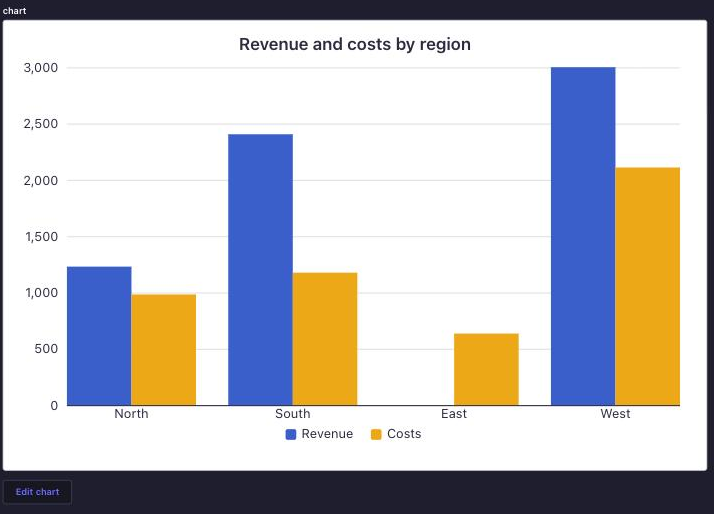
It shows what it parsed before replacing anything - above, four categories, two series, and one unreadable cell called out. The parser has to guess whether the first row is a header, and a wrong guess that silently overwrites your data is far worse than one you can cancel.
From the Media Library. Pick a .csv, .tsv or .txt you already
uploaded. Anything else is refused before it is fetched - handing a PDF to a CSV
parser produces a confident table of nonsense.
By hand, in the grid.
Rendering it
The field stores a ChartSpec - the same object the renderers take. Nothing
sits in between:
import { Chart } from '@qkix/chartkit-react-renderer';

<Chart spec={article.chart} locale="en-US" />;
---
import { Chart } from '@qkix/chartkit-astro-renderer';
---
<Chart spec={article.chart} locale="en-US" /><script setup>
import { Chart } from '@qkix/chartkit-vue-renderer';
</script>
<template>
<Chart :spec="article.chart" locale="en-US" />
</template>They all produce markup at build or request time. None ships a runtime.
It takes your theme, including dark mode
The chart carries no colors of its own. Series are drawn as
fill="var(--chart-series-N, currentColor)" and text inherits the page font, so
a chart looks like it belongs wherever it lands:
:root {
  --chart-series-1: #4945ff;
  --chart-series-2: #f0a500;
  --chart-axis: #8e8ea9;
  --chart-text: #32324a;
  --chart-grid: #eaeaef;
}

[data-theme='dark'] {
  --chart-text: #ffffff;
  --chart-grid: #32324a;
}
This is the reason the SVG is hand-written rather than produced by an existing SSR chart renderer. The obvious candidate, ECharts in SSR mode, writes its palette into the markup as literal hex values - which makes class-based dark mode impossible without post-processing the output.
When one chart needs to say something else
Under Colors in the editor there is a swatch per series - per slice, on a pie or donut. Leave one alone and it keeps following your stylesheet; set one and that series overrules it, which is what picking out a single line or reddening the quarter that went wrong requires.
Only the entries you set are stored, so highlighting one series does not freeze the colors of the others against your next restyle. The cross beside a swatch hands that series back to the site.
A color set here beats the CSS on purpose. The stylesheet is the house style; a chart that names a color is overruling it for a reason, and a house style that could silently repaint it would be no override at all.
Also a block, if you use Better Blocks
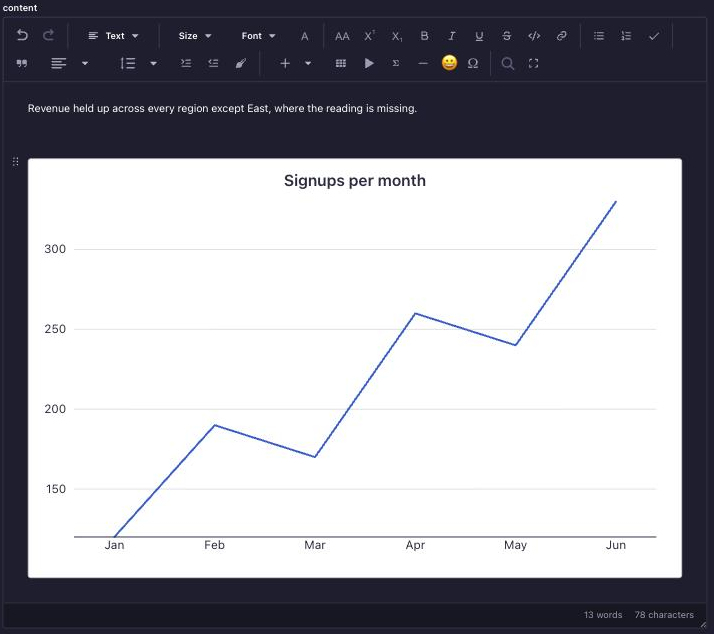
Charts can live inside a rich-text document instead of, or as well as, in a
field of their own. With
Better Blocks
installed, that is one line in src/admin/app.tsx:
import { registerBlock } from '@qkix/strapi-plugin-better-blocks/strapi-admin';
import { chartBlockDefinition } from '@qkix/chartkit-editor/block';

export default {
  register() {
    registerBlock(chartBlockDefinition({ locale: 'en-US' }));
  },
};
The front end needs its own half - chartBlockPlugin from whichever renderer
you use - or a chart authored in a document is stored correctly and drawn as
nothing.
Field options
| Option | Effect |
|---|---|
| Number formatting locale | How axis numbers are formatted in the admin preview - a BCP 47 tag such as de-DE. The front end passes its own at render. |
| Required | Standard Strapi validation. |
Old charts stay working
The spec is versioned, and the field migrates on read, so opening a chart
saved against an older schema edits and saves the current shape. Nothing has to
be resaved for a site to keep working: renderChart migrates in memory too.
If a field holds something that is not a readable chart - a value from an import script, or a field that used to be a different type - it says so and goes read-only rather than offering to overwrite it.
Packages
| Package | For |
|---|---|
@qkix/strapi-plugin-chartkit | this plugin - the field in the Strapi admin |
@qkix/chartkit-core | the spec, the validator and the SVG renderer. No dependencies. |
@qkix/chartkit-react-renderer | rendering a stored chart in React / Next.js |
@qkix/chartkit-astro-renderer | rendering a stored chart in Astro |
@qkix/chartkit-vue-renderer | rendering a stored chart in Vue / Nuxt |
@qkix/chartkit-editor | the editing surface, and the ready-made block |
Not there yet
Being honest about the edges: no tooltips or other interactivity. Data is stored with the chart rather than queried from a collection, so a chart of something that changes is a chart somebody has to remember to update.
Issues and ideas welcome at qkix/strapi-plugins.
Roadmap
What is worth building next, what is deliberately not planned, and why: ROADMAP.md.
License
MIT